Business Intelligence is a Management Decision Support Framework that empowers business users to understand data, resulting in actionable insights that improve the business.
In the current market, we have many business intelligence tools that help organizations to manage the large data and provide better, meaningful information through several data transformation and appealing visualizations, like Microsoft Power BI. Business Intelligence helps organizations to convert data into information, information into knowledge and knowledge into plans that guide the organization.
What is Microsoft Power BI?
Power BI is a suite of business analytics tools that deliver insights throughout your organization. Connect to hundreds of data sources, simplify data prep, and drive ad hoc analysis. Produce beautiful reports and publish them for your organization to be able to consume on the web and across mobile devices. Everyone can create personalized dashboards with a unique, 360-degree view of their business. Moreover, scale across the enterprise with governance and security built-in.

Power BI on-preises
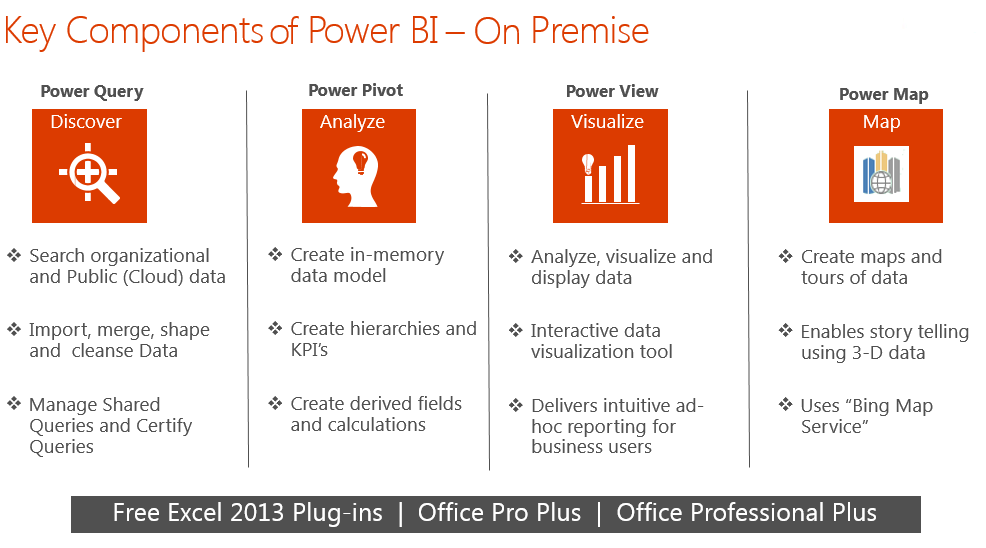
Microsoft launched the first release of Power BI that was on Microsoft Excel–based add-ins: Power Query, Power Pivot, and Power View. You can install the Add-in and use the feature of Power BI within existing excel, so let’s discuss all features in details.
Features of on-premises Power BI:
Power BI on cloud
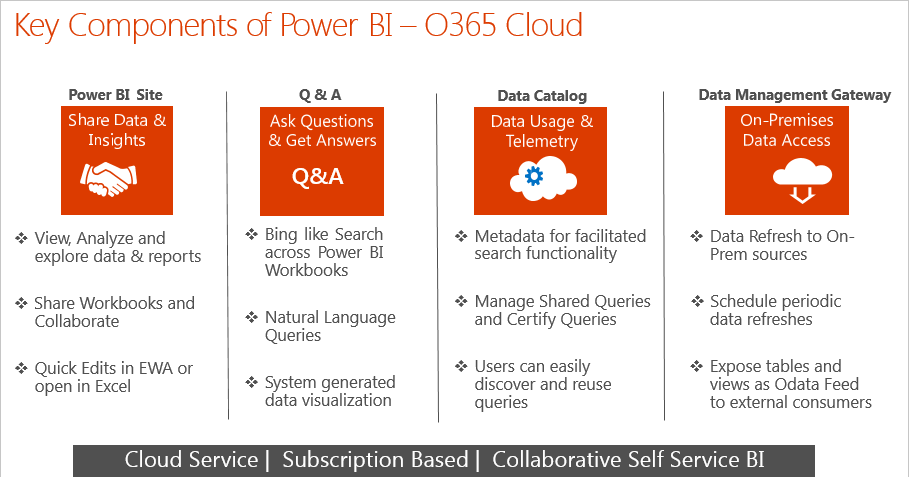
Microsoft also added many additional features like Question and Answers, Enterprise Level Data Connectivity and Security Options via Power BI Gateways. Power BI was first released to the general public on July 24, 2015, with Power BI Desktop, which contains all features we have in On Premise. However, with this feature, we can publish you report dashboard on Power BI Site (Cloud) and share it with other, as well as sync data hourly, daily and weekly.
Features of Power BI on cloud:
3 useful features in Power BI
1) Power Query
This feature is available in both on Premise (Excel 2013) and on Cloud (Power Desktop).
In Power Query, you can connect multiple data sources and make transformation step by step within Data before creating report or Dashboard.
How to get Power Query
On Premise: Power Query is a free add-in from Microsoft for Excel 2010 and 2013 and you can install it with this Link.
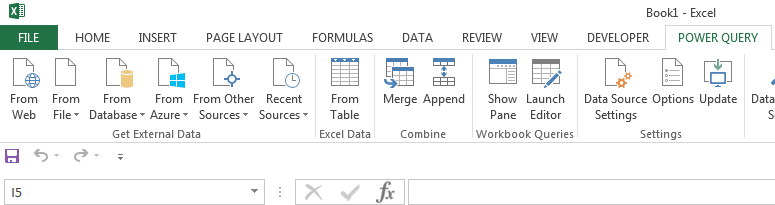
Once you installed it, you can see the new Ribbon in Excel Power Query
On Cloud: Power Query is also free but in cloud version, it comes with Power BI desktop. You can install it with this Link.
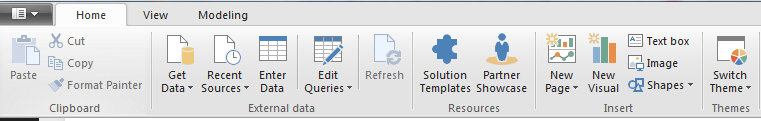
Once you install Power BI Desktop you can see the Power Query option as Get DATA.
Multiple Data Source Connection
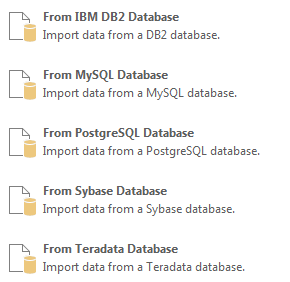
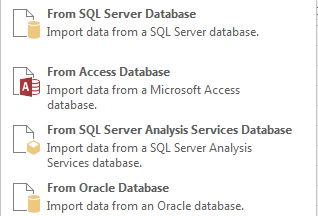
Here are the Data Sources available in Power Query.
Database Connectors: This feature allows you to connect to various databases like SQL, Oracle, and Big Data etc. and connect with multiple tables as a live connection, which auto sync after refresh.
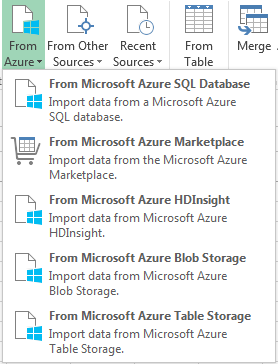
Microsoft Azure: Microsoft Azure is a cloud-based infrastructure where you can create Virtual Machine, Server, and Storage through Physical servers. Power BI is also a Microsoft Product, so it is very easy with power BI to connect cloud-based Database like Azure SQL Database, Azure My SQL database.
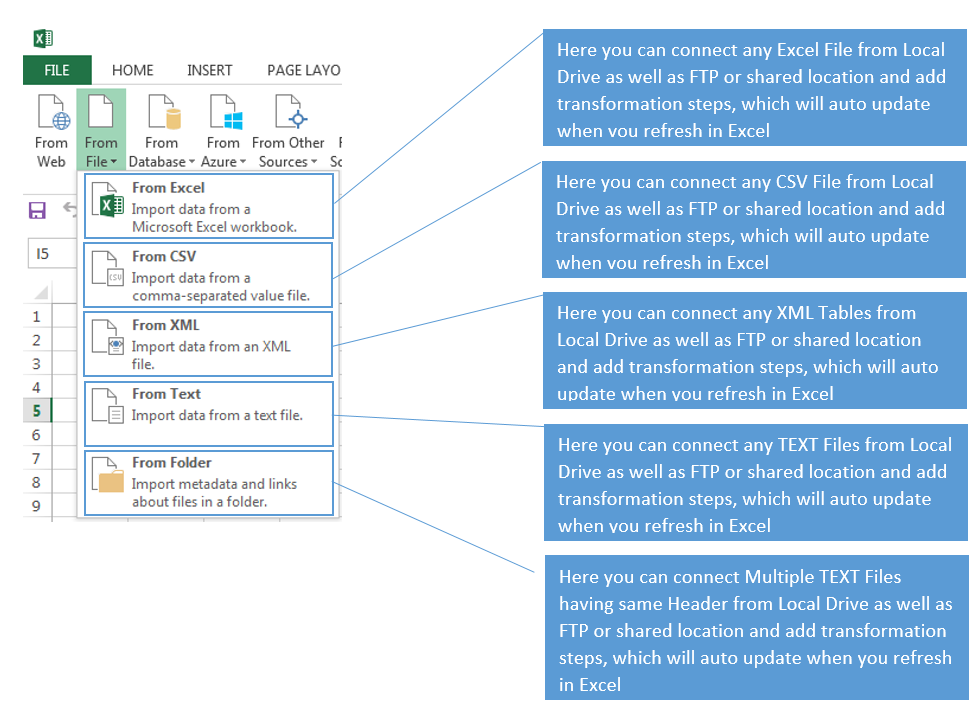
From File connection – In this feature, we can connect to Excel, CSV, XML as well as multiple .txt files from a particular folder.
Details of each from File Connection Listed below.
Walkthrough: Steps to connect SQL Table in Power BI Desktop.
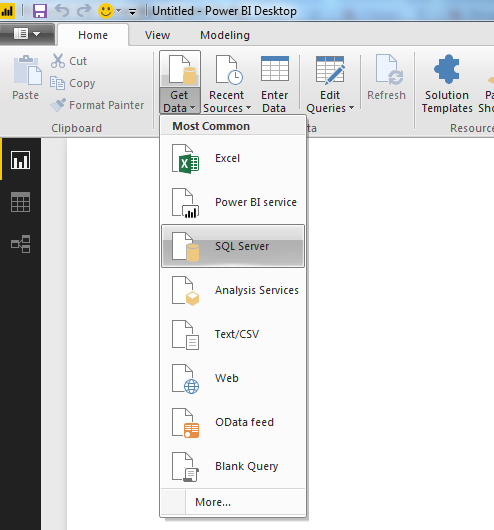
- Open Power BI desktop and click on Get Data Option.
- Click on SQL Server
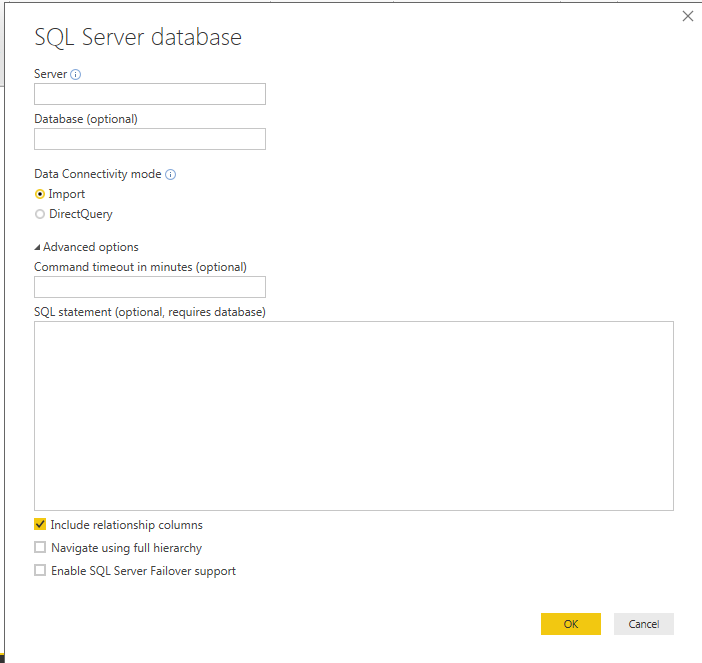
- Enter Server Name and Database Name from which you want to Fetch or link the Table, you can also enter you custom query in “SQL Statement” option in case of an advance query.
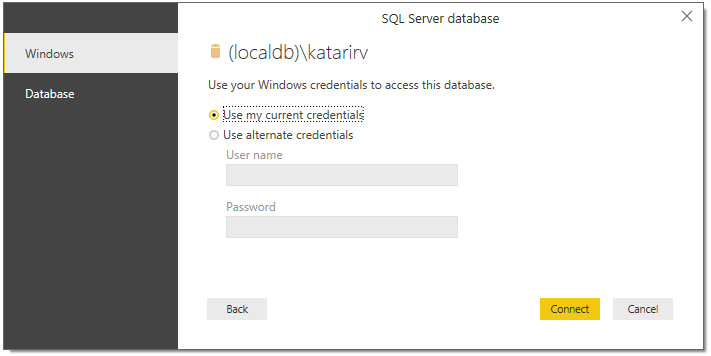
- Enter the Credentials in case you have a separated SQL server username and password. You can use the Database option or the Window credential. I have selected the first option “Windows” to connect to the SQL Server.
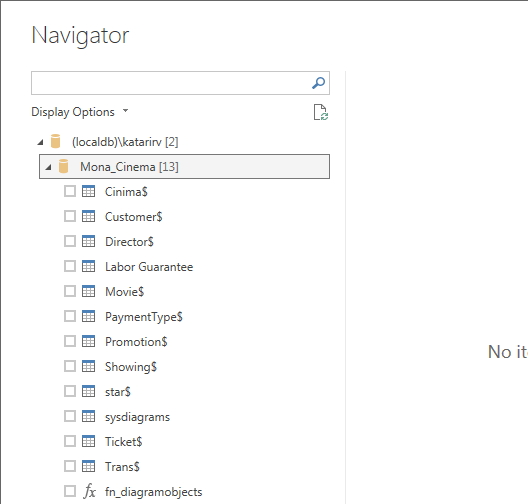
- Select the Tables and click Load.
You can see how simple and easy it is to connect Server Database with Power Query. You can use the same steps in Microsoft Both Power BI on Premises or Cloud using the same 5 steps.
Transformation
Data Transformation: The second most useful feature we have in Power BI is to connect data and then make a transformation in data. When you refresh the data connector all transformations that you have applied will automatically be recalled and data will get updated with all changes.
Note – it will not make any changes in source data and all changes are with a data connection.
Some of the most commonly used transformations are mentioned below:
DAX- Data Analysis Expressions (DAX) is a library of functions and operators that can be combined to build formulas and expressions in Microsoft SQL Server Analysis Services, Power Pivot in Excel, and Power BI Desktop.
DAX contains most advanced formulas that can be used to calculate YTD sales, Previous Year Sales, Previous Year Same Day Sales on Run Time. You only need to connect data and make transformation steps once.
There are two primary calculations you can create using DAX:
- Calculated columns
- Calculated measures
Merge: Merge is another type of combining queries, which is based on matching rows, rather than columns. The output of Merge will be a single query with;
There should be joining or matching criteria between two queries, for example, the direct ID column of both queries must match
Number of rows will be dependent on matching criteria between queries
The number of columns will depend on the columns selected in the result set. Merge will create a structured column as a result.
Example for Merge Query
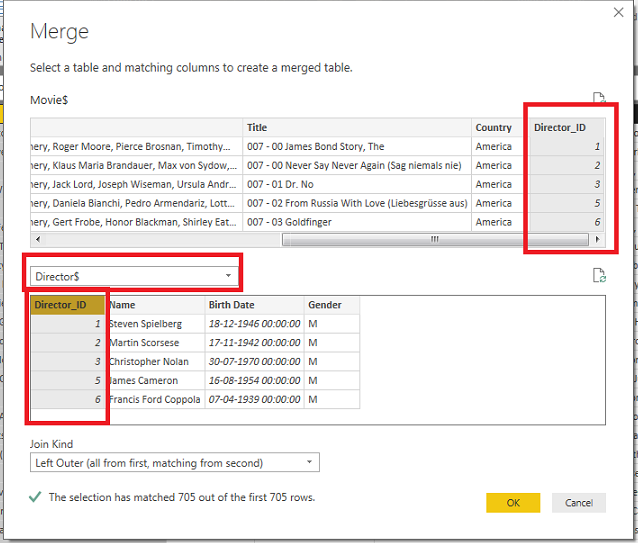
We have imported two tables (Movie and Director) from SQL server in which the Director Id is common and we want to fetch Director Name in movie table. These are the steps we followed:
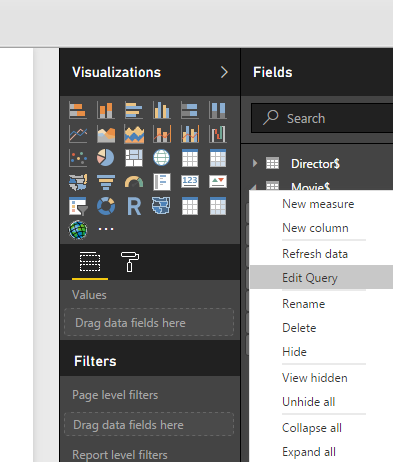
- Right click on movie table and select Edit Query
- 2. Click on Merge Queries
- Select the Director table in the second drop down, then select Director_ID (Movie Table) and Director_ID (Director Table) from both tables, then click OK.
- At the end, you will see New Column, select Director Name from the drop down and select the Director name
- Go to the Home Tab and press Click and Save
2) Power Pivot
PowerPivot is an add-in for Microsoft Excel 2010 and onward versions that enable you to import millions of rows of data from multiple data sources into a single Excel workbook, It also helps you to create relationships between heterogeneous data, create calculated columns and measures using formulas, build PivotTables and PivotCharts, and more.
On-premises: Power Pivot is also free add-in from Microsoft for Excel 2010 and 2013, you can install it with this Link.
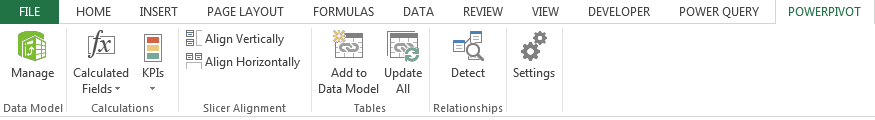
Once you have installed it, you can see the new Ribbon in Excel Power Pivot.
On cloud: Power Query is the free, in-cloud version that comes with Power BI desktop. You can install it with this Link.
Once you have installed Power BI Desktop you will be able to see the Power Pivot option as “Relationships”
Power Pivot creates relationships between two or more table on the basis of a primary and foreign key, which is further used in Reporting and Visualization.
PowerPivot for Excel 2010 and PowerPivot for SharePoint, currently in their first version, were released in May 2010 as part of the Microsoft SQL Server 2008 R2 that was released and in Power BI Desktop. It is integrated with Relationships.
When you load data tables in Power BI Desktop it automatically detects the relationship between tables.
3) Power View
Power View is a data visualization technology that allows you to create interactive charts, graphs, maps, and other visuals that bring your data to life. Power View is available in Excel, SharePoint, SQL Server, and Power BI.
Power View is available in both versions of Power BI; in Excel, you have to buy the professional version and in Power BI cloud version it is integrated with Power BI Desktop, which is free to use.
To install Power View in Excel, click this Link Remember: It only works in Microsoft Excel Professional version.
You can start to build your report or dashboard in Power BI Desktop version once you have connected your data, as discussed in the Power Query Feature.
With Power View, you can create interactive charts and add Drill down in single charts. You can also map Visualization that is built into auto pick a country, region or pin code and convert it into latitude and longitude to plot a data point on a map. Finally, you can develop your own custom Visualization through Power Bi Developer.